
This recipe shows you how to create custom reports to analyze your created and solved tickets by date, and by a specific day of the week.
What you'll need
Skill level: Easy
Time required: 20 minutes
-
Explore Professional
-
Editor or Admin permissions (see Adding users to Explore)
-
Ticket event data in Support
How to create the report in Explore
- In Explore, click the query icon (
 ) .
) . - In the Queries Library, click New query.
- On the Select a dataset page, select the dataset containing the ticket data you'll need to build the query; in this case, Support: Tickets updates.
Query Builder opens.
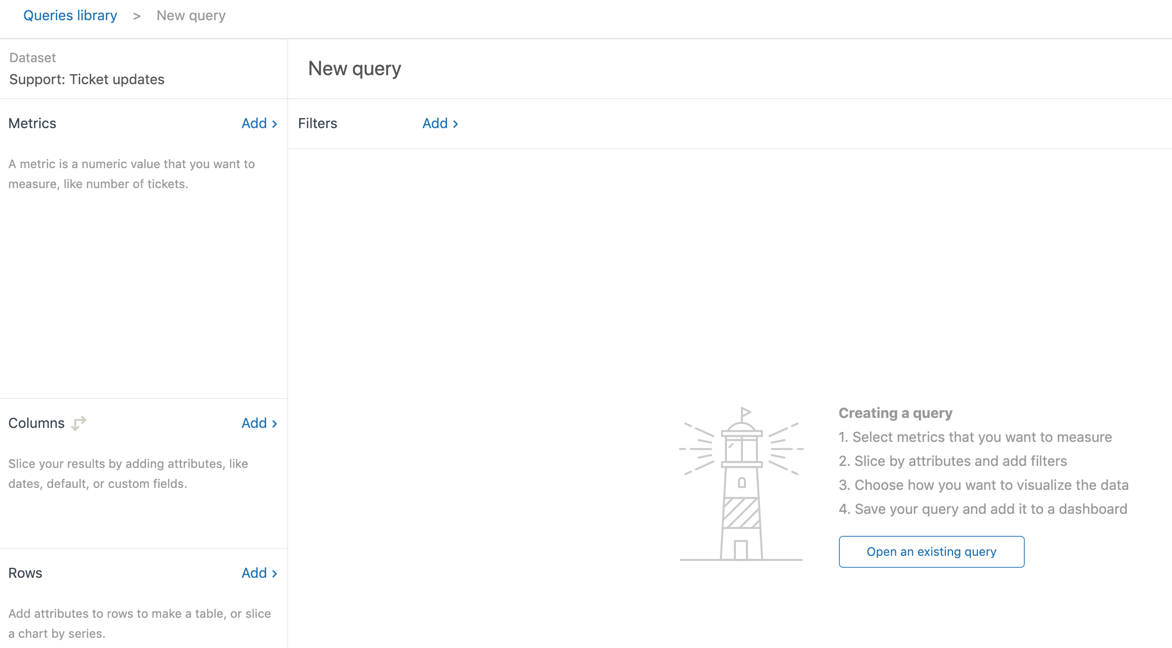
- Next, add your metrics; the things you want to measure, in this case, the number of tickets created and solved. In the Metrics panel, click Add.
- In the metrics list that appears, expand the Tickets section, select Tickets created and Tickets solved, then click Apply.

- Next, apply a date range. In the Filters panel, click Add
- In the list of attributes, expand the Time - Ticket update section, choose Update - Year and then click Apply.
- Click Update - Year, and then Edit date ranges. You can choose one of the simple time ranges offered, or move to the Advanced tab for more options.


- In the Columns panel, add the attribute Update - Date, which will show the daily results for the period you chose previously.
- In the Visualizations menu on the right sidebar, select the Column chart type.

- In the chart configuration menu (
 ), go to the Chart section, click Stacked, and uncheck Aggregated values.

- In the chart configuration menu, go to the Displayed values section - click to show the values, inside the columns, and choose the colour and size that you want.
In the chart configuration menu you can also change the colours of the series, edit and format the x-axis and y-axis titles and labels, move the legend, and many other things!

- Click Save to save the query. If you are ready, you can also add the query to a dashboard. Otherwise you can reopen the query in the library later.

Reporting on Tickets Created and Solved by Day of the Week
- Follow steps 1 to 8 above. When you add Update - Year at step 8, click the Advanced tab, and in the drop-down lists, select a full number of weeks, such as 12 weeks in the past to 1 week in the past, so you get an accurate picture of activity by weekday. Click Apply.

- In the Columns panel, expand the Time - Ticket Update section, select Update - Weekday, and click Apply
- In the chart configuration menu, go to the Displayed values section - click to show the values, and choose the colour and size that you want for those values.
In the chart configuration menu you can also change the colours of the series, edit and format the x-axis and y-axis titles and labels, move the legend, and many other things!

- Click Save to save the query. You can also add the query to a dashboard now if you are ready. Otherwise you can reopen the query in the library later.
Comments
0 comments
Please sign in to leave a comment.